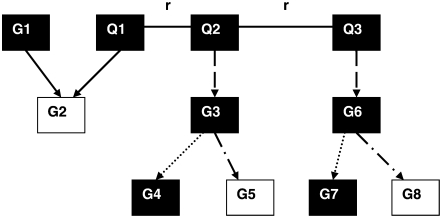
Figure 1.—
The network model used in the simulation study for regulator–target pair identification. Solid squares with letter Q, causal polymorphisms in the same eQTL region; solid squares with letter G, genes located in the eQTL region; open squares with letter G, genes not located in the eQTL region but affected by it; solid arrows, true trans-regulations; dashed arrows, true cis-regulations; dotted arrows, true cis–trans-regulations of target genes located in the eQTL region; dashed-dotted arrows, true cis–trans-regulations of target genes not located in the eQTL region. Solid lines among the Q polymorphisms represent direct genetic linkage (recombination rate = 0 or 0.09).

