
Figure 2.
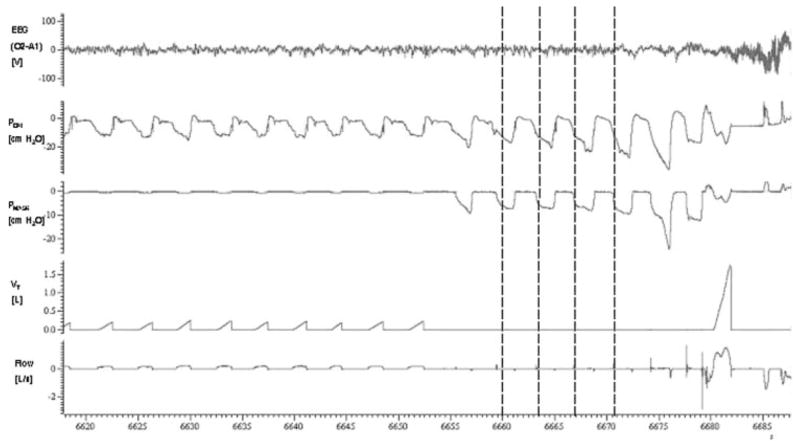
Typical response to airway occlusion (in a 68-year-old subject). During occlusion, each inspiratory effort produced a decrease in Pmask and Pepi. While Pepi progressively decreased to a minimum value, Pmask separated from Pepi during breaths 2 to 5 as the result of pharyngeal airway collapse. The inflection points (Pclose) of the Pmask trace (vertical lines) were defined as the points at which airway collapse occurred. Note that airway collapse (ie, the plateau in Pmask) does not occur on breath 1. This may be due to a decrease in expiratory lung volume between breaths 1 and 2 (subjects were able to exhale through an expiration valve). Minimum Pepi values became more negative with each subsequent respiratory effort until arousal from sleep occurred. The arousal threshold was defined as the nadir Pepi at the respiratory effort preceding arousal.