
FIGURE 4.
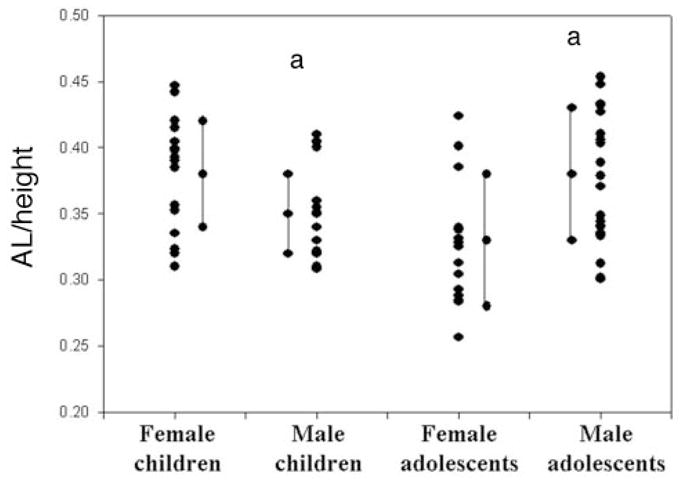
Plot of individual UAL/height ratio of subjects in each group along with the average and SD for each group (children = prepubertal; adolescents = postpubertal). a P < .05 (between girls and boys in each pubertal group).
Official websites use .gov
A
.gov website belongs to an official
government organization in the United States.
Secure .gov websites use HTTPS
A lock (
) or https:// means you've safely
connected to the .gov website. Share sensitive
information only on official, secure websites.
Plot of individual UAL/height ratio of subjects in each group along with the average and SD for each group (children = prepubertal; adolescents = postpubertal). a P < .05 (between girls and boys in each pubertal group).