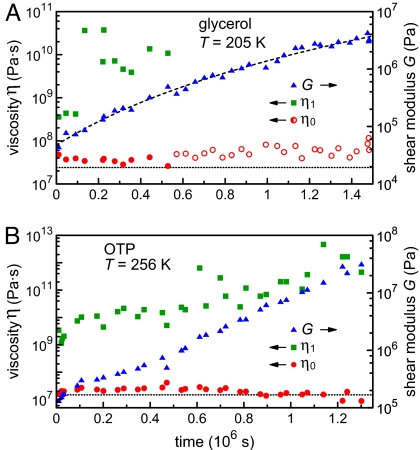
Fig. 3.
Aging of glycerol and OTP. (A) Aging of the shear modulus G (right y-axis) and of the viscosity parameters η0 and η1 (left y-axis) of glycerol at 205 K as functions of time over a period of 2 weeks. Note that the system already presented a weak shear modulus at the beginning of the measurements. The values of the effective viscosity η1 (squares) depend on the applied stress (see Fig. 4). The measurements up to 5 × 10⁵ s were done at a shear stress of 107 Pa (filled circles representing η0), and later measurements at 213 Pa and 427 Pa (open circles). The dotted line corresponds to the viscosity derived from the liquid response at large stress, which is close to the literature value. The dashed curve, drawn through the shear modulus data points (triangles) as a guide to the eye, is a fit by a power law of time, G(Pa) = 10−18.5 × [t(s) + 750,000]3.9. (B) Aging of OTP over a period of 2 weeks at 256 K. The plot shows the evolution of the viscosities η0 (circles, left y-axis) and η1 (squares, left y-axis), as well as of the shear modulus G (triangles, right y-axis). The dotted line denotes the viscosity value derived from the liquid response during initial cooldown, which is in agreement with previous measurements.

