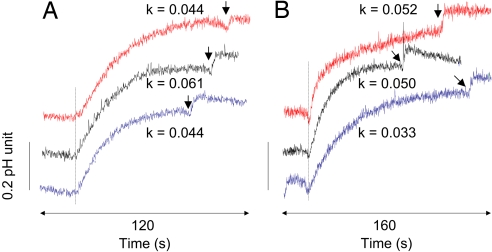
Fig. 6.
Proton and potassium conductance of liposomes and proteoliposomes. Shown is pH variation of liposomes (blue trace) and proteoliposomes containing wild-type AmtB (black trace) or the double variant F107A/F215A (red trace) when applying a pH pulse of 1 unit by adding 5 mM KOH. The dashed line indicates addition of 1 μM valinomycin in A and 1 μM FCCP (carbonyl cyanide-p-trifluoromethoxyphenyl-hydrazone) in B. The arrow on each trace indicates the addition of 1 μM FCCP in A and 1 μM valinomycin in B. The alkalanization rate constant (k, s−1) resulting from the charge equilibration due to the equilibration of H+ (A) and K+ movement (B) is noted above each trace. The apparent proton permeabilities P′H, measured as described in the text, were 2.0 × 10⁻⁸, 2.8 × 10⁻⁸, and 2.0 × 10⁻⁸ cm/s for liposomes and proteoliposomes containing wild-type AmtB or the double variant, respectively. The apparent K+ permeabilities P′K were 1.5 × 10⁻⁸, 2.3 × 10⁻⁸, and 2.5 × 10⁻⁸ cm/s. Experiments were performed at 20°C.

