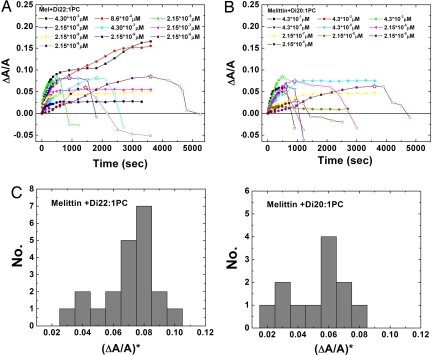
Fig. 4.
Fractional area increase of GUV in time at various concentrations of melittin. Only a small number of representatives are shown here. The data for each run ended when the image became invisible because of photobleaching. (A) GUVs of di22:1PC. The area increase ΔA was calculated from the increase of the projection length ΔLP at constant vesicle volume: ΔA = 2πRP(1 − RP/RV)ΔLP. To keep the figure simple, the same relation was used to indicate a decrease in ΔLP by a decrease in ΔA [in fact, a negative ΔLP is due to volume increase at constant area (see text)]. The beginning of projection decrease indicates the onset of pore formation (marked by a star). (B) Same as A for lipid di20:1PC. (C) Histograms for the values of ΔA/A for the onset of pore formation, (ΔA/A)*, from all measurements. The most frequently occurring ΔA/A values for the onset of pore formation are 0.08 and 0.06 in lipid di22:1PC and lipid di20:1PC, respectively.

