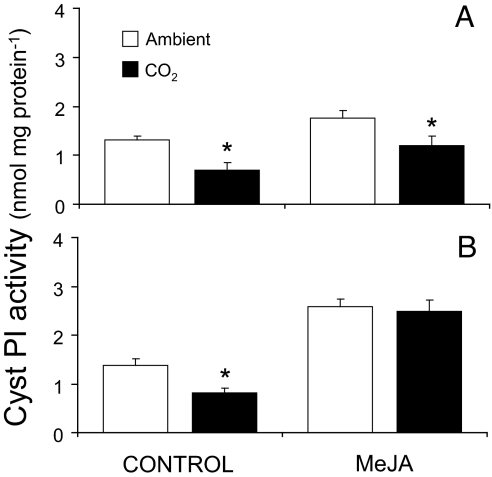
Fig. 4.
Total proteinase and cysteine proteinase activities in the gut of beetles. (A and B) JB (A) or WCR (B) fed for 3 days on soybean leaves grown under ambient or elevated CO2. Values represent the average of four independent samples (one replicate per FACE plot). Azocaseinolytic and cysteine proteinase activities are represented in different units. Asterisks indicate the level of significant differences between ambient and elevated CO2 treatments (*, P < 0.05; **, P < 0.001; ***, P < 0.0001).

