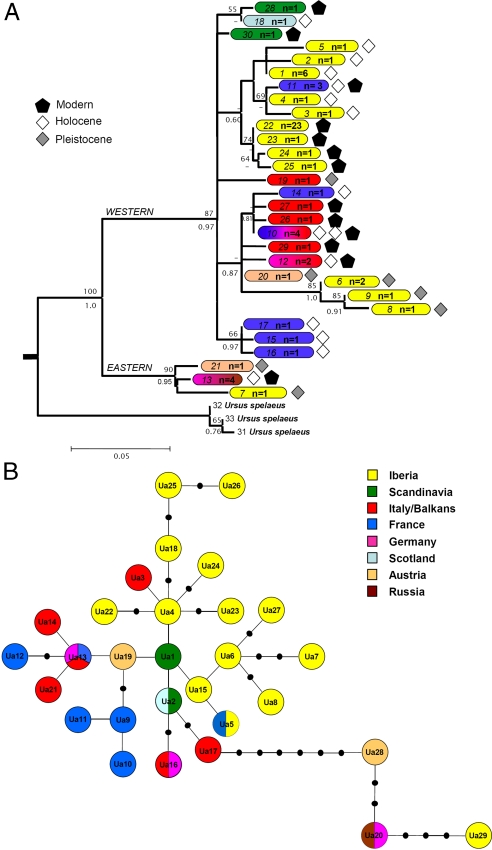
Fig. 1.
Past and current genetic diversity. (A) Bayesian phylogeny generated by using ancient and modern brown bear European sequences (long dataset) and three cave bears as outgroup. Bootstrap values are shown above the node, and posterior probabilities are shown under the nodes. The color of each square represents the geographic origin, the number in italics indicates the haplotype (see SI Dataset 2), and the “n” is the haplotype frequency. (B) Minimum spanning network showing the haplotype distribution of ancient and modern brown bear sequences (short dataset). Numbers inside the circles indicate the assigned haplotype from a total of 29 haplotypes obtained.

