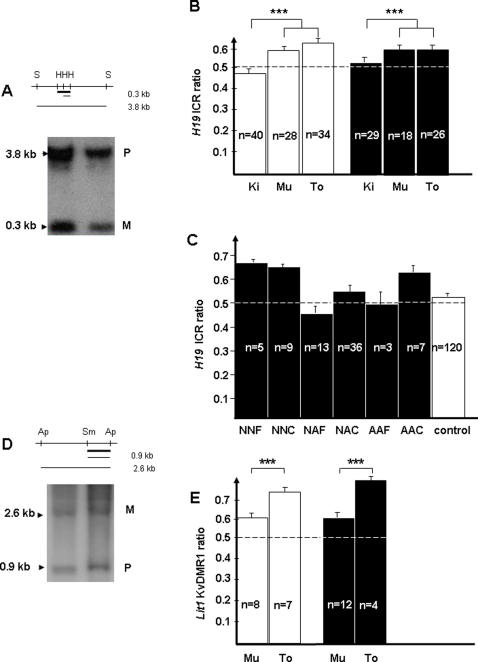
Figure 7. Methylation status of H19 ICR and Lit1 KvDMR1.
(A) H19 ICR methylation was determined by Southern blotting after digestion with Sac I (S) and Hha1 (H) enzymes. The upper band (3.8 kb) corresponds to the paternal methylated allele (P) and the lower band (0.3 kb) corresponds to the maternal unmethylated allele (M). Probe is marked by thick black line. (B) H19 ICR methylation was analyzed in DNA from three tissues: kidney (Ki), muscle (Mu), and tongue (To) in unmanipulated (white) or grafted animals (black). ***, p<0.001 for kidney compared to both other groups (muscle and tongue) (C) H19 ICR ratio was represented in unmanipulated (control, white) or grafted animals (black) in three tissues according to the manipulated group. (D) Lit1 KvDMR1 methylation was determined by Southern blotting after digestion with Sma I (Sm) and Apa I (Ap) enzymes. The upper band (2.6 kb) corresponds to the maternal methylated allele (M) and the lower band (0.9 kb) corresponds to the paternal unmethylated allele (P). Probe is marked by thick black line. (E) Lit 1 KvDMR1 ratio was compared in muscle (Mu) and tongue (To) from unmanipulated (white bar) or grafted animals (black bar). ***, p<0.001 for tongue vs muscle.

