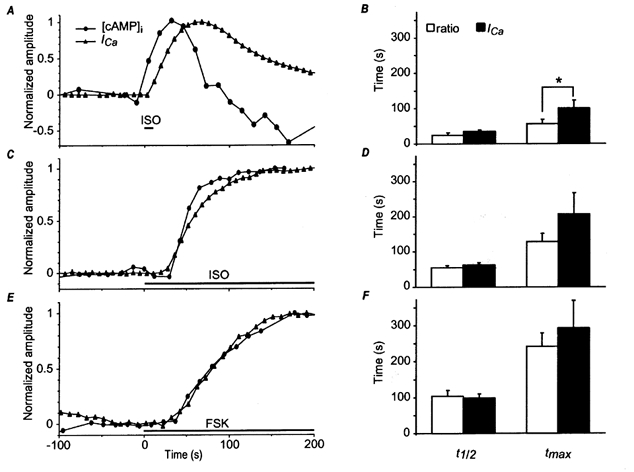
Figure 5. Comparison of [cAMP]i and ICa responses to isoprenaline and forskolin.

Frog ventricular myocytes were perfused with FlCRhR and the [cAMP]i and ICa responses were normalised to their maximal amplitudes. The [cAMP]i trace was corrected for the linear rundown due to bleaching by fitting a line to the last 5 data points preceding the drug application. A, focal application of 20 μm isoprenaline (ISO) during 10 s. B, average response of 4 cells. C, focal application of 0.1 μm ISO, which was then maintained throughout the rest of the experiment. D, average response of 3 cells. E, focal application of 13 μm FSK, which was then maintained throughout the rest of the experiment. F, average response of 4 cells. In B, D and F, the bars indicate mean t1/2 (time for half-maximal response) and tmax (time for maximal response) values and the lines the s.e.m. for [cAMP]i (open bars) and ICa (filled bars) responses. *Statistically significant difference at P < 0.05.
