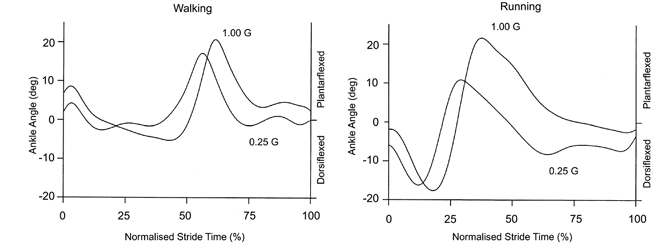
Figure 2. Typical ankle movement patterns for a single subject walking and running at 1.0 G and 0.25 G.

The ankle movement patterns were very similar at all gravity levels, but there was slightly less ankle dorsiflexion during the first part of the stance phase under simulated reduced gravity. We defined 0 deg as each subject’s standing posture. The curves represent the average of seven to 10 strides at each condition. Heel strike is at 0% normalised stride time.
