
Figure 2. Effect of SAG and LLA on Ba2+ influx.
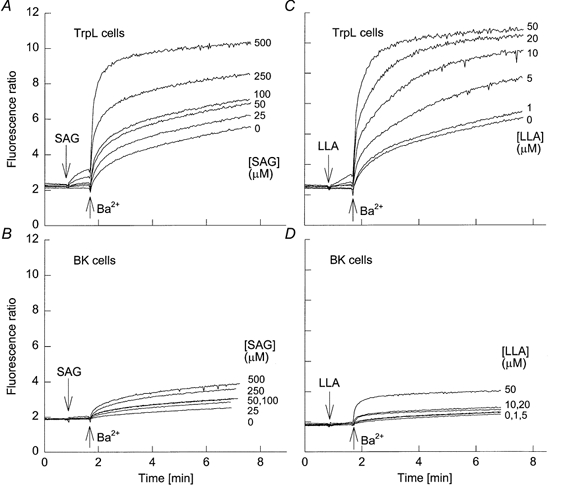
A and B, six traces are shown superimposed. TrpL cells (A) or BK cells (B) were suspended in nominally Ca2+-free MBS. SAG was added to each trace at 50 s at the indicated final concentrations followed by Ba2+ (10 mm) at the times indicated. C and D, same protocol as in A and B, but with LLA added at the indicated concentrations at 50 s followed by Ba2+.