
Figure 6. Comparison of BK-stimulated TrpL current with LLA-induced currents.
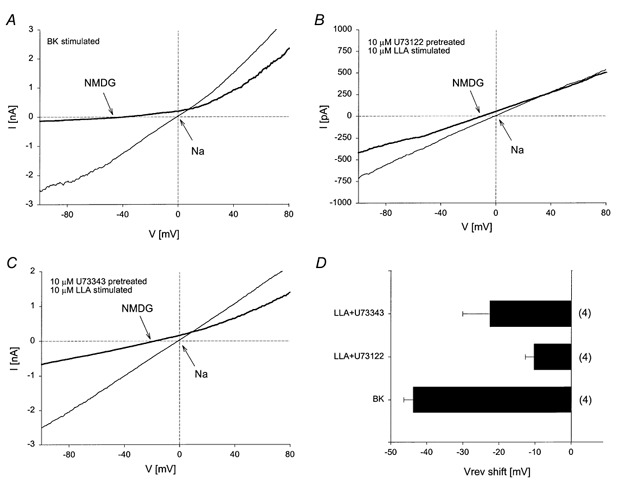
A, whole-cell current was recorded from BK:TrpL cells in symmetrical sodium gluconate solutions. Following activation of TrpL by bradykinin, Na+ in the bath solution was isosmotically replaced with NMDG+ and the I-V relationship obtained. B and C, whole-cell currents were recorded as in A from TrpL cells with the indicated treatments shown in each panel. D, histogram showing the mean ±s.e.m. reversal potential (Vrev) shift following the exchange of Na+ with NMDG+ in the bath solution for the conditions shown in A, B and C; n is shown in parentheses to the right of each bar.