
Figure 6. Models to explain the experimental results.
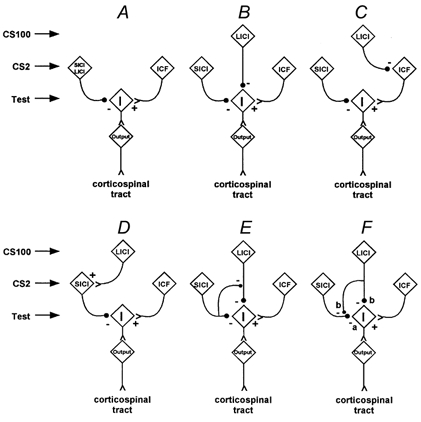
Each box in the figure schematically indicates the population of cells responsible for mediating ‘SICI’, ‘LICI’, ‘ICF’, or the response to the test stimulus alone. The box labeled ‘I’ indicates the source of descending I-waves, and ‘output’ indicates the corticospinal output cell populations. The diagram is for illustration, and the populations may be heterogeneous or include further internal circuitry. The filled circles represent inhibitory synapses, and the letters ‘a’ and ‘b’ indicate the hypothesized presence of primarily GABAA or GABAB receptors.