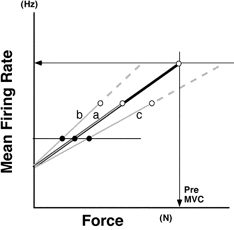
Figure 7.

Schema showing illustrative voluntary force-MFR relationships plotted without force being normalized with respect to MVC
The voluntary force-MFR relationship after immobilization was drawn in three different ways for illustrative purposes (grey lines, labelled a-c) relative to the pre-immobilization line (black line). All of these lines are assumed to have the same intercept. The relationships are each extended up to MVC and maximal MFR (○), both of which show a reduction after immobilization (Table 1, Fig. 6). See text for further explanation.
