
Figure 3.
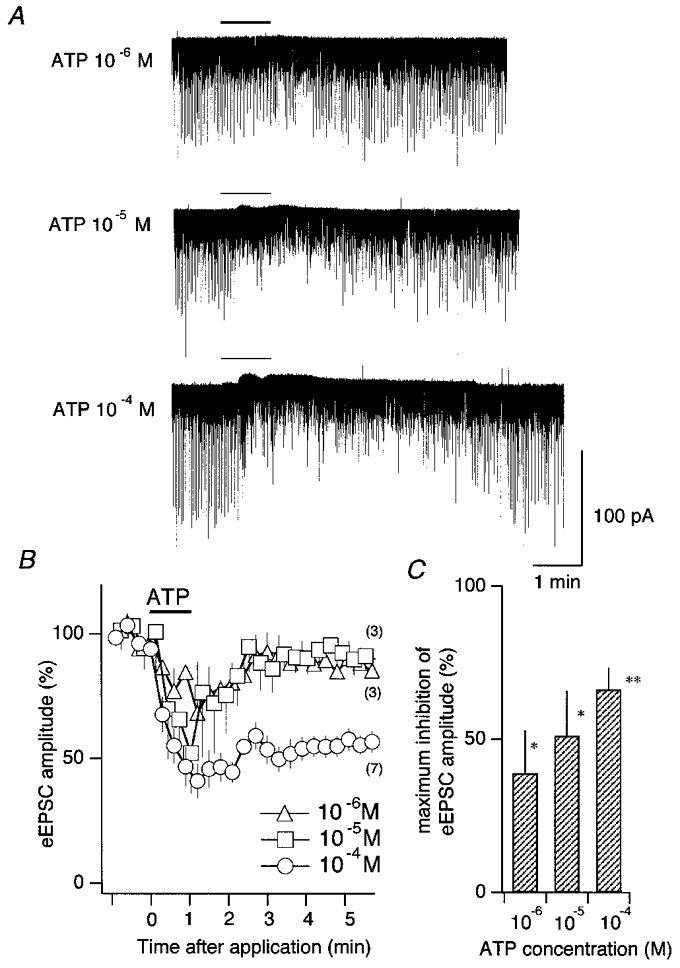
Inhibitory effect of ATP on eEPSCs of second-order cNTS neurones
A, effects of focal application of ATP, 10−6 m (top), 10−5 m (middle) and 10−4 m (bottom), on transmembrane current and eEPSCs. The period of application (1 min) is shown as a horizontal bar above each trace. Downward deflections represent the eEPSCs evoked by solitary tract stimulation at every 2.01 s; the stimulus artefacts were digitally annulled before plotting. B, the time course of the effect of ATP. Abscissa, time after ATP application. ATP was applied from 0 to 1 min (horizontal bar). Ordinate, eEPSC amplitude normalised to the pre-application mean. Each symbol and vertical bar represents the mean and s.e.m., respectively, of eEPSC amplitude averaged over nine consecutive stimuli. Numbers in parentheses indicate the number of neurones in which the same protocol of ATP application and stimulation was done for each ATP concentration. C, mean and s.e.m. (vertical bar) of the maximal inhibition of eEPSC amplitude in individual neurones. *P < 0.05; **P < 0.01. The number of neurones used are the same as in B.