
Figure 5.
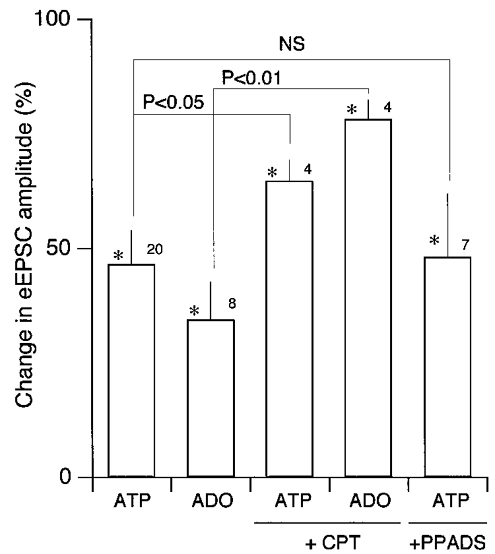
Summary of the effects of ATP and adenosine (ADO) on the eEPSC amplitude
Means and s.e.m. (vertical bar) of the eEPSC amplitude normalised to mean values before agonist application. *Significantly different from the values before agonist application at P < 0.05. NS, not significantly different. Numbers above each column indicate the number of neurones used. The concentrations of ATP, adenosine, CPT and PPADS were 10−4 M, 10−4 m, 10 μM and 40 μM, respectively. Statistical comparisons were made with Mann-Whitney U test.