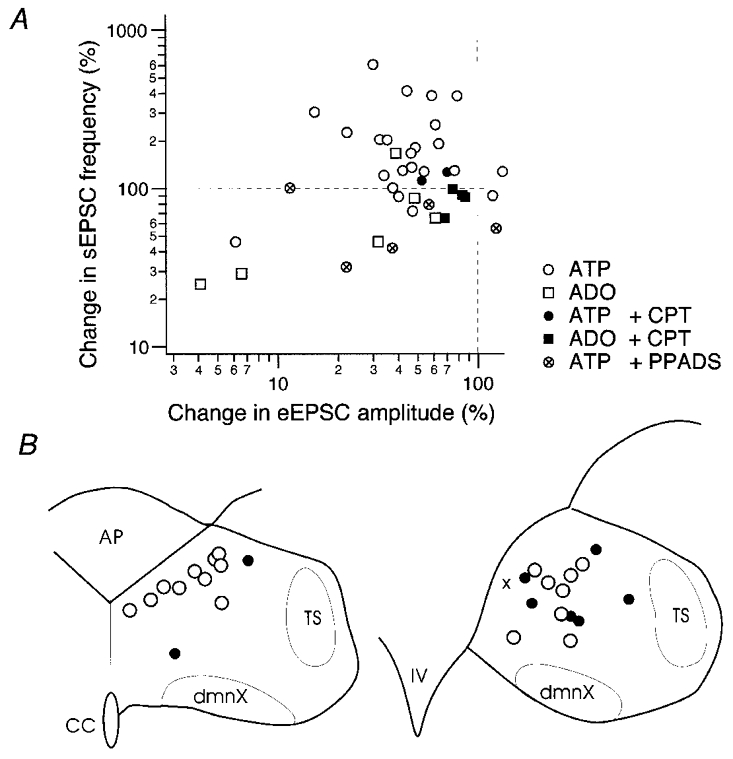
Figure 10.

Summary of the changes in EPSCs in individual neurones by ATP and adenosine (ADO) and their location within the cNTS
A, relation of the changes by agonists in eEPSC amplitude (abscissa) and sEPSC frequency (ordinate) in individual neurones. Changes are normalised to the preapplication values. Each symbol represents the changes measured in each neurone. Legends of symbols are shown in the inset. ATP and adenosine were applied at 10−4 M. The concentrations of CPT and PPADS were 10 and 40 μM, respectively. Dashed horizontal and vertical lines at 100 % indicate that agonists induced no change in eEPSC amplitude and sEPSC frequency, respectively, of neurones whose symbols are on these lines. Note that the largest population of open circles (application of 10−4 M ATP without any blockers) is located in the upper left quadrant with respect to the dashed lines. B, location of cNTS neurones reconstructed based on infrared photomicrographs. Left, a coronal section at the subpostrema level; right, at the level of obex. AP, area postrema; TS, solitary tract; dmnX, nucleus dorsalis motorius nervi vagi; CC, the central canal; IV, the fourth ventricle. ○, location of neurones with both reduced eEPSC amplitude and increased sEPSC frequency by ATP application; •, neurones showing either reduced eEPSC amplitude or increased sEPSC frequency by ATP application; ×, a neurone showing none of the above with ATP application.
