
Figure 1. Effects of weak acid application and removal on pHi and [Ca2+]i in voltage-clamped snail neurones.
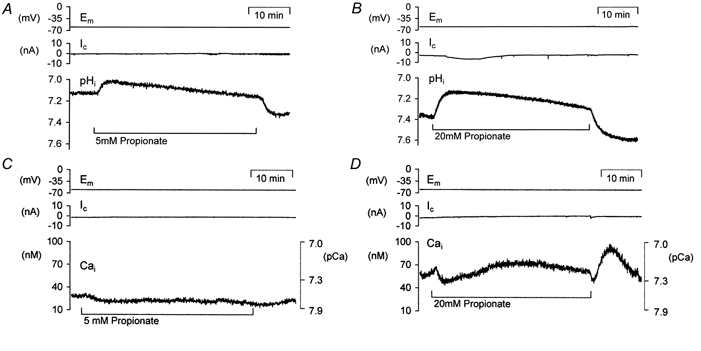
A and B, records of voltage-clamp potential (Em), clamp current (Ic) and pHi (using HPTS) during and after prolonged exposure to different concentrations of the weak acid propionate. C and D show parallel recordings of [Ca2+]i (using fura-2) during and after exposure to the same concentrations of propionate. Calcium data are plotted as nanomolar concentrations and secondary axes showing equivalent pCa values have been included (see Methods).