
Figure 4. Kinetic properties of Ito1 in normal and hypertrophied hearts.
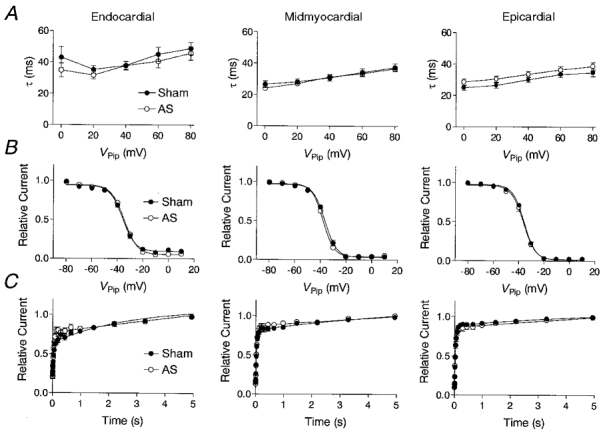
Inactivation (A), steady-state inactivation (B), and recovery kinetics (C) of Ito1 recorded from endocardial, midmyocardial and epicardial myocytes of sham-operated (•) and AS (○) rats. A, inactivation time constants (τ) were estimated at holding potentials ranging from Vpip= 0 mV to Vpip=+80 mV by mono-exponential fitting of the current decay. B, steady-state inactivation was determined by a two-step pulse protocol: a conditioning pulse of 600 ms duration ranging from -80 to +10 mV in steps of 10 mV was followed by a step to +60 mV for 600 ms. The magnitude of Ito1 detected at +60 mV after the conditioning pulse was normalized to Ito1 recorded at a conditioning potential of -90 mV in each individual experiment, and is given as a function of the conditioning pulse potential. Data were fitted assuming a Boltzmann kinetic of steady-state inactivation. C, recovery from inactivation was determined by two consecutive pulses to +60 mV, each of 600 ms. During the interval between the two depolarizations, Vpip was returned to -90 mV. The interval between the voltage pulses ranged from 5 to 5000 ms and increased exponentially, with 1.5 being the exponent. Pulses were delivered at 0.1 Hz. The magnitude of Ito1 recorded during the second voltage pulse was normalized to the magnitude of the first, and plotted versus the duration of the interval between the voltage pulses. Recovery curves were fitted using a bi-exponential function.