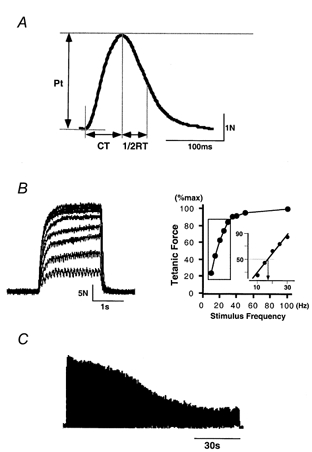
Figure 1.

Methods used for evaluation of contractile and fatigue properties in FDI muscle
A, twitch contraction evoked by per-cutaneous muscle stimulation with a single square-wave pulse (300 μs). Ten traces were averaged. Pt, peak twitch tension; CT, contraction time; 1/2RT, half-relaxation time. B, left, superimposed tetanic contractions evoked by application of nine different stimulus frequencies (10, 15, 20, 25, 30, 35, 40, 50 and 100 Hz), each for 2 s. Right, stimulus frequency-force relationship obtained by plotting peak force achieved in nine tetanic contractions against stimulus frequency. Inset, a regression line was calculated for data from the steep region of this curve (indicated by the boxed area) and the stimulus frequency required to generate half the maximal tetanic force (arrow) was obtained from it. C, fatigability tested using electrical stimulation (a 40 Hz burst for 330 ms administered every second for 120 s). See Methods for details.
