
Figure 4. Group mean responses to a moderate step increase in work rate.
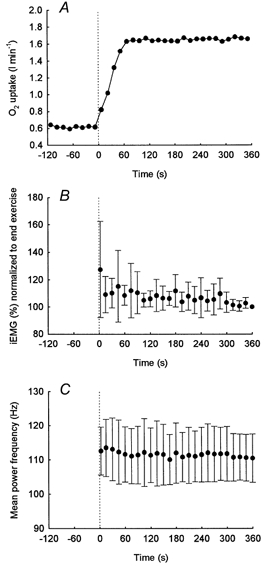
The group mean response for O2 uptake (A), integrated EMG (B) and mean power frequency (C) during a step increase in work rate of moderate intensity below the lactate threshold.