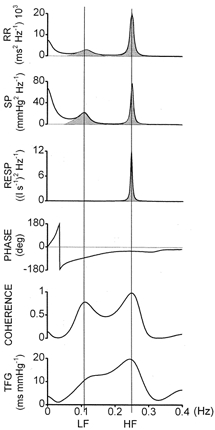
Figure 1. Example of spectral and cross-spectral analysis in control conditions.

From top to bottom: power spectra of heart period (RR), systolic pressure (SP) and respiratory airflow (RESP); phase, coherence and transfer function gain (TFG) between RR and SP. Stippled areas show how powers were calculated; vertical lines identify points of maximal coherence in low (LF) and high (HF) frequency ranges, for reading exact frequency, TFG and phase shift (see text for further details).
