
Figure 10. The effects of NPY on transmitter release are mediated by NPY receptors acting directly at neurotransmitter-releasing terminals.
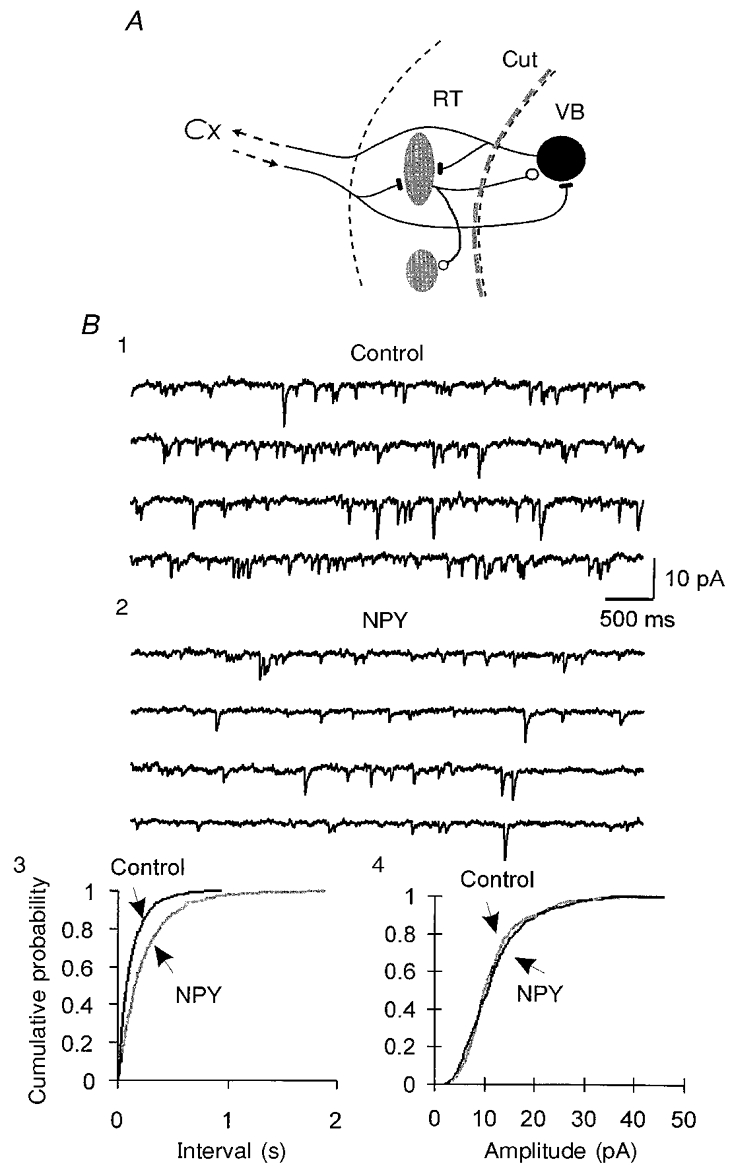
A, schematic diagram showing the surgical cut between RT and VB. Recordings of sIPSCs were made 1.5 h after the cut in the VB nucleus. B, sIPSCs were recorded in a VB neuron after the dissection shown in A, in the presence of AP-5 and DNQX in the physiological perfusion solution. Four consecutive traces in control (1) and in 200 nM NPY (2) are shown. B3, cumulative probability distributions of sIPSC intervals from 3 min periods before (Control) and during the application of NPY in the same cell. B4, cumulative probability plots of sIPSC amplitudes for control and NPY conditions for the neuron of B1 and 2. Vh, −90 mV; estimated ECl, −55 mV.