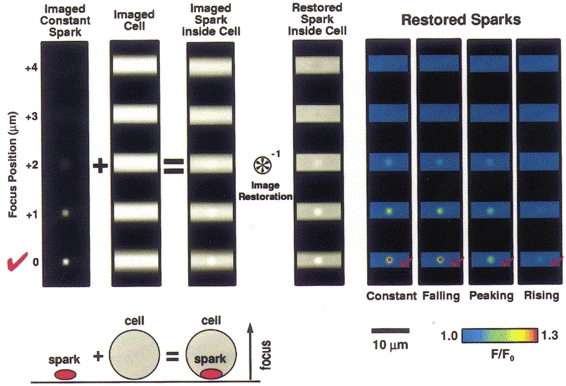
Figure 3. Simulations of sparks within a cell of constant fluorescence and the effects of image restoration.

Simulated sparks (of the sort shown in Fig. 2) were added to a cylinder of constant fluorescence, simulating a spark within a cell, as represented by the diagram lower left (drawing not to scale). The upper left portion of the figure shows images of the case where the spark remains constant during the imaging sequence. The spark was then added to a simulated cell image. The cell was simulated as a cylinder 5 μm in diameter with the long axis lying perpendicular to the axis of focus; the cell was ‘filled’ with a fluorescence background equivalent to the fluo-3 fluorescence at rest (100 nM) observed in the cells used in the experiments here. The spark images represented 30 % peak changes above resting level similar to experimental data (see below). The combination was subjected to image restoration by deconvolution (see Methods). The restored, simulated sparks are shown at the right for the four different time courses considered in Fig. 2. In all cases it was possible to correctly identify the location where the spark occurred within the five plane 3D data set.
