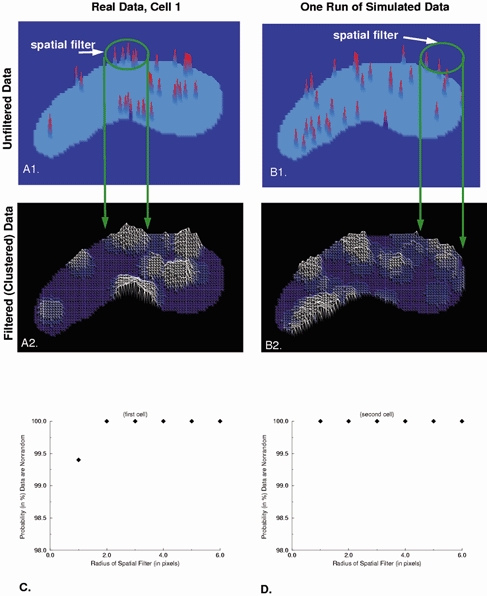
Figure 5. Two-dimensional imaging reveals non-uniform spatial distribution of spark locations within the cell.

In order to assess the non-uniform nature of the distribution of spark locations quantitatively, the analysis which is described in detail in the text was carried out. A, each spark location obtained in the 2D imaging sequences was assigned a value of 1 when one spark occurred there, a value of 2 if two occurred, etc. (A1). Then the output illustrated in A1 was convolved with a disk 5 pixels in diameter and unit value (i.e. the spatial filter illustrated in A1). B, simulated outputs generated by a randomly sampled uniform distribution (using the same number of sparks) processed in an identical manner. The amplitude of the contour plots in A2 and B2 are proportional to the average number of sparks within the area of the disk. The contour plots generated from random distributions (but having the same finite number of sparks as the experimental data in A1) also show clustering behaviour. C and D, the clustering behaviour of the experimental data and simulated random data differed for each of two cells for spatial filters of different radius. The measure chosen for comparison was the sum of the squared difference at every pixel from a uniform distribution.
