
Figure 5. Changes in Ca2+ release, Ca2+ uptake and Ca2+-ATPase activity as a percentage of pre-exercise after and 3.5 h after the exercise.
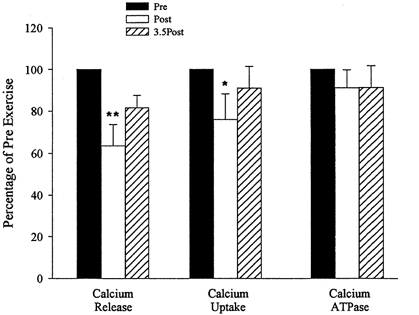
Values are means ±s.e.m. ** Significantly different from pre-exercise, P≤ 0.01; *P≤ 0.05.
Official websites use .gov
A
.gov website belongs to an official
government organization in the United States.
Secure .gov websites use HTTPS
A lock (
) or https:// means you've safely
connected to the .gov website. Share sensitive
information only on official, secure websites.
Values are means ±s.e.m. ** Significantly different from pre-exercise, P≤ 0.01; *P≤ 0.05.