
Figure 3. Peak force response versus caffeine concentration at different SR load levels.
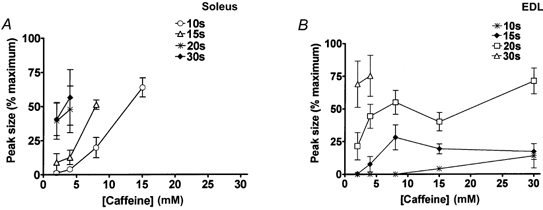
A, soleus fibres were exposed to the indicated caffeine concentration under the standard conditions (1 mm Mg2+, pCa 7.1, 50 μm EGTA) after loading the SR for the indicated time (pCa 7.0, 1 mm total EGTA), as in Fig. 2. Each point shows the mean (±s.e.m.) of the force response (as a percentage of maximum Ca2+-activated force) in 4-8 fibres. When loaded at close to the endogenous level (20 ( ) or 30 s (♦) loading at pCa 7.0), soleus fibres gave large force responses to 2 or 4 mm caffeine. B, EDL fibres gave no response to 2 mm caffeine and only a small response to 4 mm caffeine when the SR was loaded at close to the endogenous level (∼15 s loading at pCa 6.7; ♦), but the SR could be loaded considerably above this level (by 20 or 30 s loading), with a resulting increase in responsiveness to caffeine. Each point indicates the mean (±s.e.m.) for 4-9 fibres.