
Figure 6. Response of an EDL fibre in 3 mm Mg2+ at different load levels.
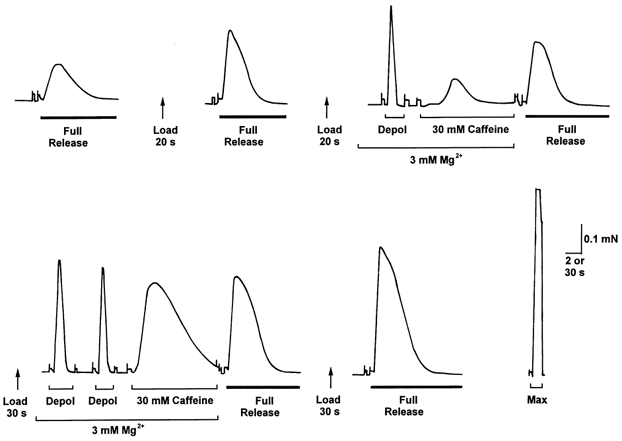
The response to 30 mm caffeine was greater when the SR was loaded for 30 s compared to when loaded for 20 s, but the response to depolarisation was little different. Time scale: 2 s during full release, depolarisation and 30 mm caffeine, and 30 s between such treatments.