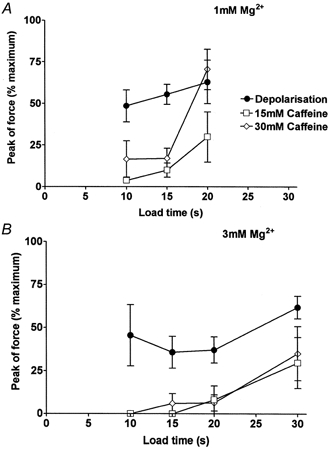
Figure 7. Relationship between SR load time and peak force response to depolarisation or caffeine in EDL fibres.

A, mean (±s.e.m.) of the peak force response to depolarisation or indicated caffeine concentration in the presence of 1 mm Mg2+, as in Fig. 5. Values in each fibre were normalised to maximum Ca2+-activated force. Data were restricted to the first response after each loading regime (e.g. caffeine response following a depolarisation, or vice versa, not included), so as to ensure that the SR was loaded at the level intended at the time of stimulation. B, mean data for responses in 3 mm Mg2+. In both A and B, loading the SR to its endogenous level required ∼15 s loading (at pCa 6.7, 1 mm EGTA) on average in these fibres. All points are means for 4-8 fibres.
