
Figure 2. Changes in pHs, lactate flux and [lactate]i in soleus (Sol) and EDL fibres in the absence and presence of extracellular sodium, cinnamate and DIDS.
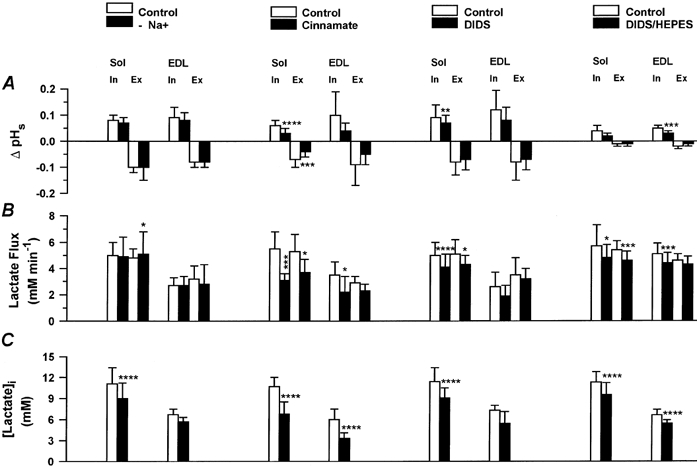
□, control data; ▪, data without Na+ in superfusing solution (n = 4 Sol, n = 3 EDL, left column), with 10 mm cinnamate (n = 7 Sol/EDL, second column from the left), with 1 mm DIDS in 28 mm HCO3−-5 % CO2-buffered superfusing solution (n = 10 Sol, n = 3 EDL, third column from the left) or with 1 mm DIDS in 15 mm Hepes-buffered superfusing solution (n = 7 Sol, n = 8 EDL, right column). Values are means ±s.d.‘In’ indicates lactate influx, ‘Ex’ lactate efflux, asterisks show levels of significance (Student's paired t test): *P < 0.05, **P < 0.01, *** P < 0.005, **** P < 0.001.