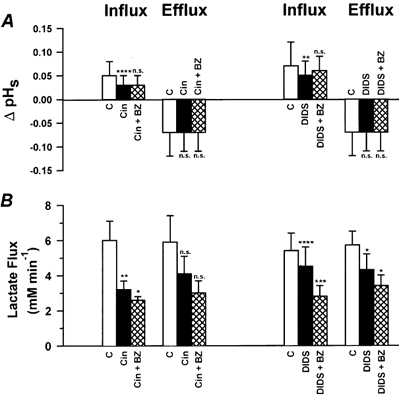
Figure 8. Changes in ΔpHs and lactate flux in soleus fibres under inhibition of the H+-lactate cotransporter by cinnamate or DIDS and under inhibition by cinnamate or DIDS plus inhibition of CA by BZ.

□, control data (C); ▪, data with 10 mm cinnamate (Cin, n = 4) or 1 mm DIDS (n = 7);  , data with 10 mm Cin plus 0.01 mm BZ or with 1 mm DIDS plus 0.01 mm BZ. Values are means ±s.d. Asterisks indicate levels of significance (Student's paired t test): *P < 0.05, **P < 0.01, ***P < 0.005, ****P < 0.001. n.s., not significant.
