
Figure 3. Current-voltage relationships for pNBC1 and kNBC1 expressed in the basolateral membrane of renal epithelial monolayers.
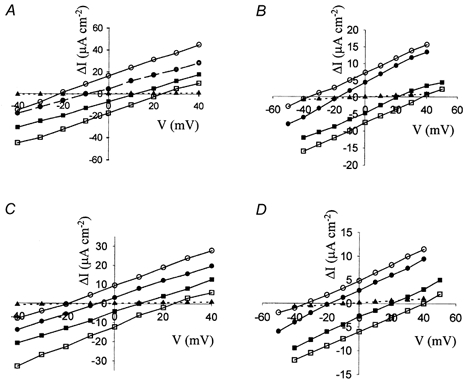
A, pNBC1 in mPCT; B, pNBC1 in mCD; C, kNBC1 in mPCT; D, kNBC1 in mCD cell monolayers. ΔI is the DNDS-sensitive current. The potential of the basal compartment is taken as zero. The ratio of AP to BL Na+ concentrations (AP/BL) were as follows: ○, 10/50; •, 10/20; ▪, 20/10; □, 50/10; ▴, mock-transfected cells, 10/50. The reversal potentials, for the different gradients, were evaluated graphically from the intersection of the lines with the X-axis and are tabulated in Table 1. Mean Isc before and after addition of DNDS for the corresponding cell lines, respectively, at AP/BL = 10/50 were as follows (μA cm−2): A, 31.2 ± 3, and 12.4 ± 1; B, 18.2 ± 2 and 10.6 ± 1; C, 23.7 ± 2 and 13.3 ± 1; D, 15.3 ± 2 and 9.2 ± 1.