
Figure 1. Dose-dependent inhibition of albumin uptake by EIPA.
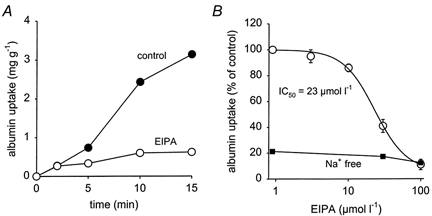
A, a typical time course of albumin uptake under control conditions (•) and in the presence of 100 μmol l−1 EIPA (○). B shows the dose-dependent inhibition. Fifteen-minute uptake values were used to calculate the IC50 value. B also shows that in the absence of Na+ (▪) albumin uptake was reduced dramatically and EIPA had virtually no further effect. n = 12-15 for each plotted value.