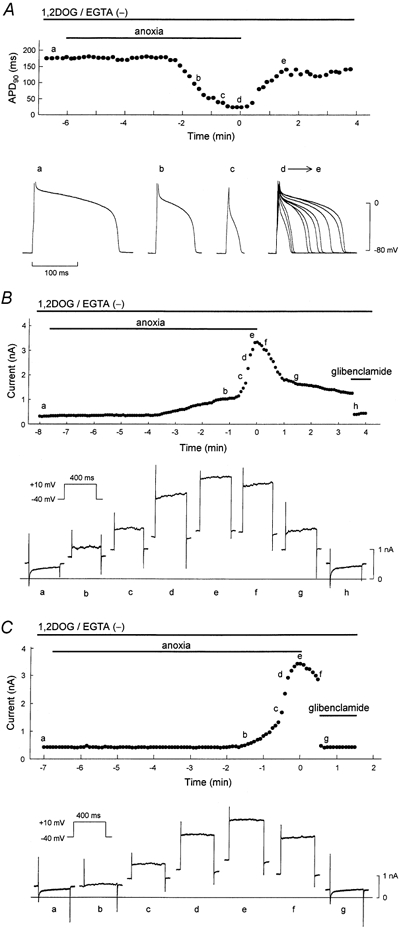
Figure 3. Representative effects of c,nPKC on APD90 and membrane current during anoxia-reoxygenation.

1,2DOG (20 μm) was perfused from 5 min before the onset of anoxia until the end of the experiment. The pipette solution was free of EGTA. A, time course of changes in the APD90 during anoxia-reoxygenation. The points designated by letters in the upper panel correspond respectively to the action potential configurations shown in the lower panel. The superimposed action potentials (d→e) are composed of 10 representative action potentials recorded from the start to 90 s of reoxygenation. B and C, serial changes in whole-cell current measured at the end of test pulse. The points designated by letters in the upper panels correspond respectively to the current traces shown in the lower panels. Glibenclamide (1 μm) was applied in early (C) and late (B) phases of reoxygenation, and during the periods indicated by horizontal bars.
