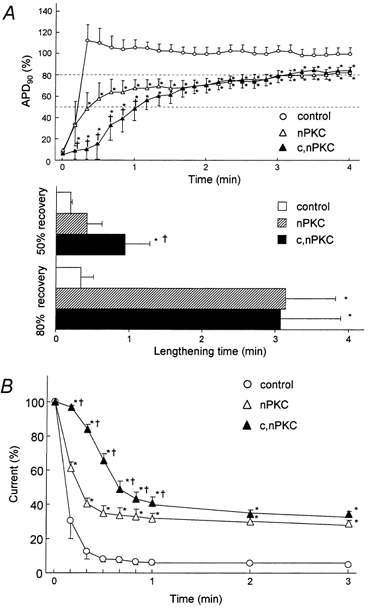
Figure 5. Summary of recovery of APD90 and IK,ATP after reoxygenation.

A, comparative changes in APD90 after reoxygenation. APD90 is expressed as a percentage of the pre-anoxic value. Lengthening time was defined as the requisite period from the onset of reoxygenation until APD90 reached 50 % and 80 % of pre-anoxic value. B, time courses of decay in anoxia-induced IK,ATP after reoxygenation. Current is expressed as a percentage of the anoxia-induced outward currents. For all three panels data are means ±s.e.m.*P < 0.05vs. control group. †P < 0.05vs. nPKC group.
