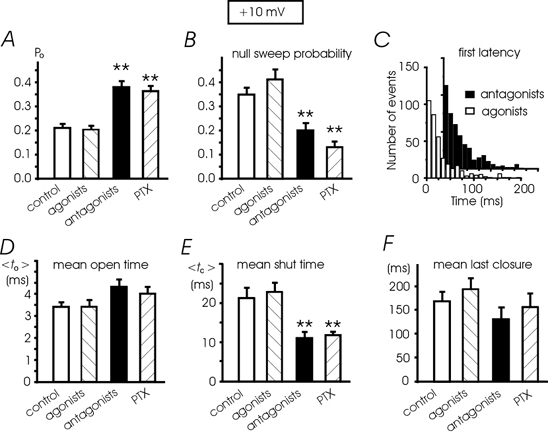
Figure 3. Single L-channel parameters in control, with the agonists and antagonists and in PTX-treated cells at +10 mV.

A, Po values calculated from n = 29 patches (control), n = 27 (agonists), n = 28 (antagonists) and n = 25 (PTX). The increment of mean Po with the antagonists (or PTX) with respect to control cells (or agonists) was statistically significant (**P < 0.01). B, mean percentage of nulls derived from 25-29 patches (see above). The values with PTX and antagonists were significantly different from control patches (**P < 0.01). C, the distributions of first latencies (+10 mV) were not significantly different in the presence of receptor agonists and antagonists; mean latency was 31.9 ± 2.0 ms (27 patches) and 33.8 ± 1.6 ms (28 patches), respectively (P < 0.5). D and E, mean to and tc (< to > and < tc >) ±s.e.m.) calculated as described in Fig. 1E. The mean tc with antagonists and PTX is significantly different from control and agonists (**P < 0.01). F, antagonists and PTX do not statistically change the mean inactivation (calculated as the mean duration of the last closure).
