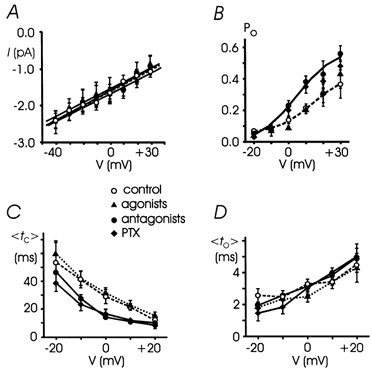
Figure 5. Voltage dependence of single L-channels in different conditions: control, agonists, antagonists and PTX treatment.

A, mean unitary current versus potential compared with control values taken from Fig. 1 (open symbols and dashed lines). Receptor agonists, antagonists and PTX treatment did not affect the single channel conductance. Linear regression on experimental data points gave 20.9 ± 0.1 pS (agonists, 4-27 patches), 20.1 ± 0.1 pS (antagonists, 4-28 patches) and 19.9 ± 0.7 pS (PTX, 4-25 patches). B, mean Poversus potential was fitted to a Boltzmann equation: V1/2=+4.7 mV; k = 11.0 mV; Pmax= 0.59 (antagonists, continuous line). Notice the enhanced Po in the presence of the antagonists or PTX. C and D, mean to and tc (< to > and < tc >) versus potential obtained from 4-28 patches. The receptor antagonists (•) and PTX (♦) decreased the mean tc between -20 and +20 mV, without significantly affecting mean to.
