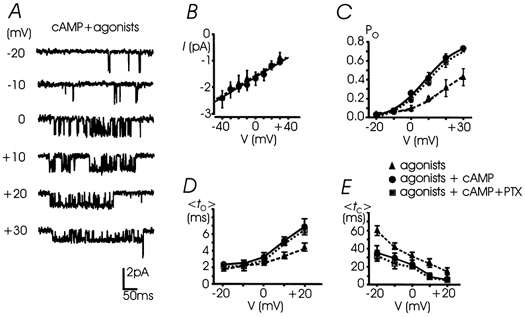
Figure 9. The voltage dependence of cAMP-potentiated L-channels.

A, unitary L-currents recorded from -20 to +30 mV after incubation with 1 mm 8-CPT-cAMP (30 min) and in the presence of ATP and opioid agonists in the pipette; Vh -40 mV. B, cAMP incubation did not significantly modify the unitary L-channel conductance (20.1 ± 0.6 pS) (•, continuous line). Data with the agonists (▴, dashed line) were taken from Fig. 5. C, cAMP induced a remarkable Po increase between 0 and +30 mV (•). The Boltzmann function fitted through data points gave V1/2=+8.0 mV, k = 9.8 mV, Pmax= 0.82 (continous curve). Cell pre-treatment with PTX caused no significant change to Po(V), which appears only slightly scaled down (▪, dotted curve) with respect to that with cAMP alone (n = 4-7 patches). D and E, mean to and mean tc plotted versus potential. cAMP incubation (•, continuous line) produced a drastic increase of mean to(V) above 0 mV and a minor but significant reduction of mean tc between -20 and +20 mV.
