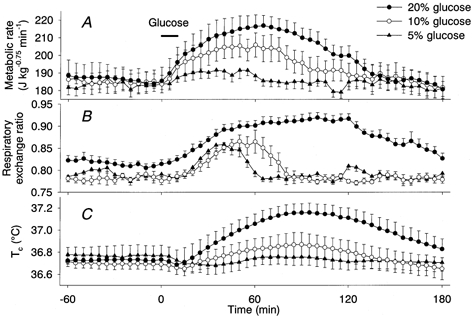
Figure 1. Dose-dependent effects of intestinal infusion of glucose solutions on the metabolic rate (A), RER (B) and Tc (C).

Concentrations of glucose were 5 % (▴, n = 5), 10 % (○, n = 5) and 20 % (•, n = 5). Horizontal bar shows the period of glucose infusion. Values are means and vertical bars are ±s.e.m.
