
Figure 2. The Zn2+-induced block and the shift of V1/2? are concentration dependent.
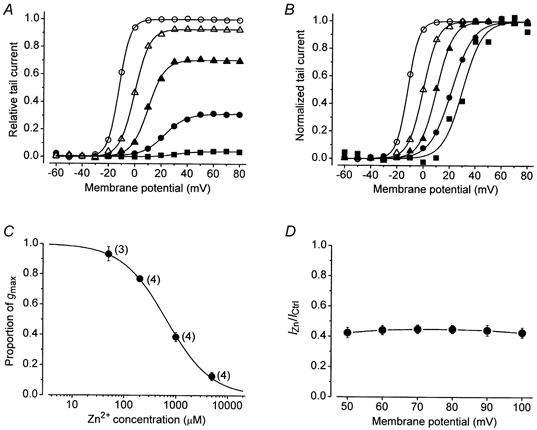
A, activation curves, derived as for Fig. 1D, showing the effect of 0 (○), 50 (△), 200 (▴), 1000 (•) and 5000 μm (▪) of Zn2+ in standard bath solution containing 5 mm K+. B, the activation curves in A after normalizing each curve to its fitted maximum. From left to right the V1/2 was -11.9, -0.1, 10.1, 22.2 and 31.4 mV and s was 4.2, 5.6, 6.2, 8.1 and 7.7 mV. C, a fit of the Hill equation to the proportion of gmax in the 50, 200, 1000 and 5000 μm of Zn2+ in medium containing 5 mm of K+ gave estimates of 650 ± 24 μm and 1.0 ± 0.03 for the equilibrium dissociation constant (KD) and the Hill coefficient (H), respectively. The number in parentheses beside each data point indicates the number of cells tested. D, in 5 cells the steady-state current at the end of 100 ms pulse commands was normalized with respect to the corresponding control current amplitude and plotted against the pulse voltage. The current ratio (IZn/ICtrl) is virtually the same at each voltage and indicates that the Zn2+ binding site does not sense the membrane electric field.