
Figure 7. Ultra-slow recovery from inactivation of Na+ channels in human DGCs.
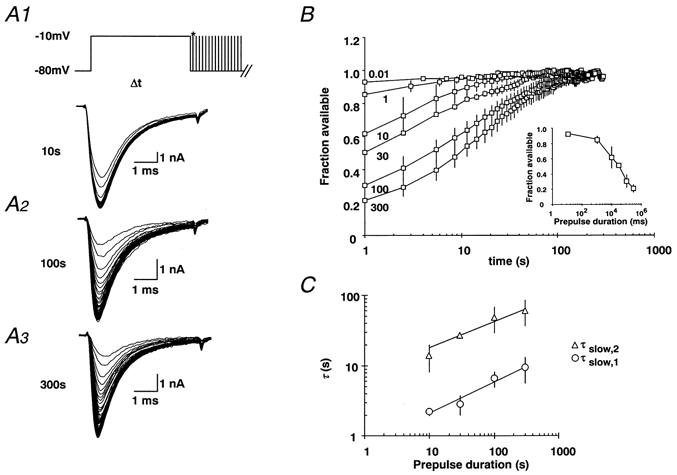
A1-A3, a conditioning pulse to -10 mV was applied for various durations (10, 100 or 300 s), as in Fig. 2. The time course of ultra-slow recovery from inactivation was monitored by a series of brief test pulses with a frequency of 0.33 Hz until the Na+ current amplitude reached saturation (Imax). B, the current amplitude during recovery of the Na+ current was normalised to Imax, yielding the fraction of available Na+ current. The normalised values were plotted against recovery time for various prepulse durations (0.01, 1, 10, 30, 100 and 300 s with n= 3, 4, 4, 2, 3 and 3, respectively). The fraction of available Na+ currents was calculated as the ratio of peak current during the first test pulse divided by Imax. As in rat DGCs, the fraction of Na+ channels showing slow recovery increases steeply with prepulse duration. C, with prepulse durations from 10-300 s, the recovery from inactivation was fitted by a biexponential function, with the two time constants τslow,1 (○) and τslow,2 (△). The relationship between the duration of prior depolarisation t and recovery time constants τ was fitted by a power law function of the form: τ(t) =a (t/a)b with a= 0.63 s and b= 0.44 for τslow,1 and a= 25 s and b= 0.37 for τslow,2 (see Table 1) shown superimposed on the data points.