
Figure 3. Comparison of relative current amplitudes.
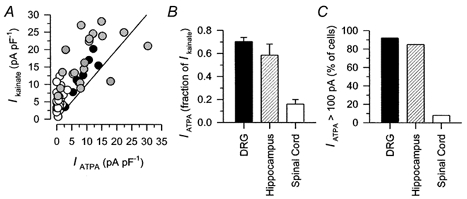
A, peak current density evoked by 300 μm kainate is plotted as a function of current evoked by ATPA in the same cell for DRG (•; correlation coefficient r= 0.92, 100 μm ATPA), spinal cord (○; r= 0.32, 100 μm ATPA) and hippocampal ( r= 0.51, 30 μm ATPA) neurons. The straight line plots an equivalent response to the two agonists. B, peak current evoked by ATPA as a fraction of peak current evoked by 300 μm kainate in DRG cells (70.3 ± 3.7 %; n= 8; 100 μm ATPA), hippocampal neurons (58.6 ± 9.6 %; n= 19; 30 μm ATPA), and spinal cord neurons (16.1 ± 4.0 %; n= 20; 100 μm ATPA). C, cells in which ATPA (30-300 μm) evoked > 100 pA of current as a percentage of all cells tested with ATPA for DRG (92 %; n= 14), hippocampus (85 %; n= 96) and spinal cord (8 %; n= 36).