
Figure 4. Activation and desensitization of DRG and hippocampal kainate receptors by ATPA.
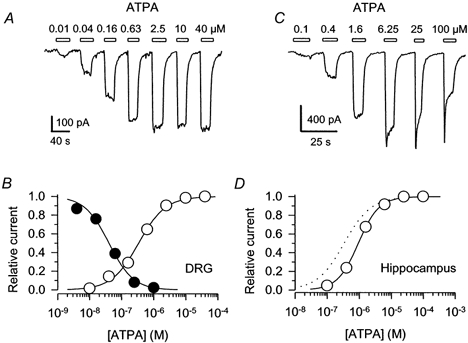
A, whole-cell currents evoked by 0.01, 0.04, 0.16, 0.63, 2.5, 10 and 40 μm ATPA in a DRG cell that had been exposed to Con A. Open bars indicate the periods of exposure to each dose of ATPA. B, ○, peak currents (means ±s.e.m.; n= 10 cells) elicited by 0.01-40 μm ATPA in DRG cells that had been exposed to Con A are plotted as a fraction of the current evoked by 40 μm ATPA. •, peak current (means ±s.e.m.; n= 3-5 cells per data point) elicited by 300 μm kainate immediately after a 10 s exposure to ATPA (normalized to the peak current with no ATPA prepulse) is plotted as a function of the ATPA concentration during the prepulse. Smooth curves show the best fits of modified logistic equations (see Methods). For receptor activation the EC50 was 341 nm (95 % CI, 312-382 nm), N= 1.0 ± 0.1. The IC50 for steady-state desensitization was 41 nm (95 % CI, 35-49 nm), N= 1.2 ± 0.1. C, whole-cell currents evoked by 0.1, 0.4, 1.6, 6.25, 25 and 100 μm ATPA in a hippocampal neuron in the presence of 100 μm SYM 2206. Holding potential, -90 mV. D, peak currents (means ±s.e.m.; n= 8 cells) in hippocampal neurons with 100 μm SYM 2206 are plotted as a fraction of the current elicited by 25 μm ATPA. The EC50 was 938 nm (95 % CI, 828 nm to 1.1 μm), N= 1.3 ± 0.1. The dotted line replots the activation curve for DRG cells from B.