
Figure 4. Comparison of GG, HG and IIC EMG activity at each level of inspired CO2 with (black) and without (grey) lung inflation in a representative animal.
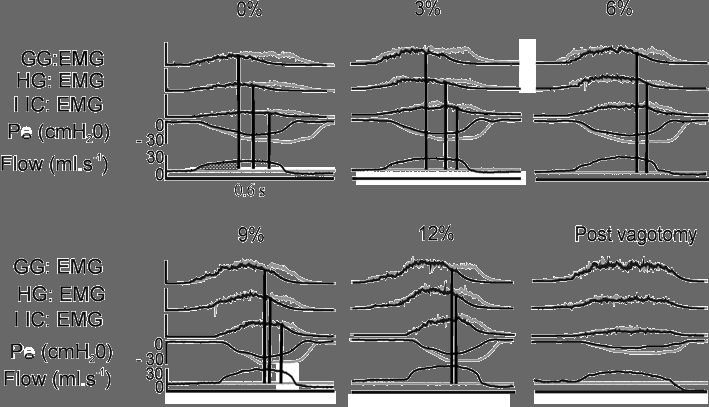
EMG activity was rectified and integrated with a time constant of 200 ms. The airflow recording corresponding to the unoccluded breath is also shown. The divergence of the occluded and unoccluded waveforms was determined by visual inspection. A vertical cursor was placed at the point of divergence and extended through the flow waveform. Integration of the area bounded by the flow waveform and the vertical cursor provided an estimate of the lung volume at which inhibition of EMG activity commenced. This is shown for the GG EMG at 0 % inspired CO2 as a shaded area on the flow signal bounded by a vertical cursor. See Methods for a more detailed explanation. The duration of all recordings was 0.6 s.