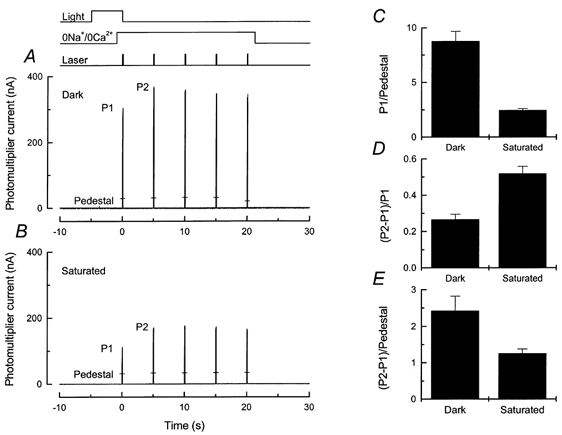
Figure 6. Effect of prior illumination in Ringer solution on the magnitude of fluo-5F fluorescence increase in 0 Ca2+, 0 Na+ solution.

Fluo 5F fluorescence responses from two different rods evoked by 100 ms laser flashes repeated at 5 s intervals are shown in A and B; protocol and laser intensity as for Fig. 3A. The responses to the first and second laser flashes have been labelled P1 and P2. Responses to a second series of laser flashes in 0 Ca2+, 0 Na+ solution 45 s after a return to Ringer solution are indicated for each trace by the bars (Ped). A, without pre-exposure to illumination. B, with 5 s prior illumination of sufficient intensity to saturate the photocurrent during the light exposure. Timing of illumination given by light monitor at the top of the figure. Note that the rod was stepped into 0 Ca2+, 0 Na+solution 4 s after the onset of illumination. Intensity of the 500 nm saturating light was 1.55 × 10³ photons μm−2 s−1. C-E, mean ±s.e.m. for 20 cells treated as in A with no pre-illumination (Dark) and 28 cells treated as in B with steady exposure to saturating light of intensity 1.4-1.6 × 10³ photons μm−2 s−1 (Saturated). Histograms are as follows: C, the amplitude of the fluorescence response to the first laser pulse (P1) has been divided by the mean value of the pedestal; D, the difference between the responses to the first and second laser pulses (P2 - P1) has been divided by P1; and E, (P2 - P1) has been divided by the mean value of the pedestal.
