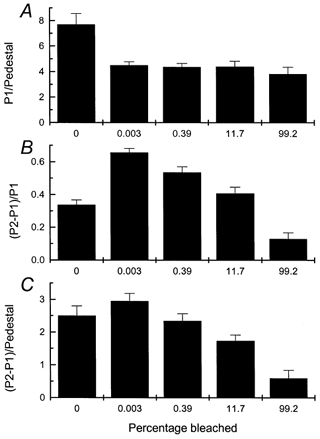
Figure 7. Magnitude of Ca2+ release as a function of the intensity of prior light exposure.

Same protocol as for Fig. 6 except that total light exposure was 3 s long (2 s in Ringer solution) and the light intensity was varied. Intensities are given as percentage of visual pigment bleached, calculated over the entire duration of the light exposure as described in the Methods; even the dimmest intensity was sufficient to saturate the rod (i.e. close all of the cyclic nucleotide-gated channels). A bleach of zero indicates paired controls for which no light exposure was given before the first laser flash. Each histogram column gives mean ±s.e.m.n = 8. A, amplitude of fluorescence response to the first laser pulse (P1) divided by mean value of pedestal. B, difference between the responses to first and second laser pulses (P2 - P1) divided by P1. C, (P2 - P1) divided by the mean value of the pedestal.
