
Figure 9. Calcium release after prior exposure to light in 0 Ca2+, 0 Na+ solution.
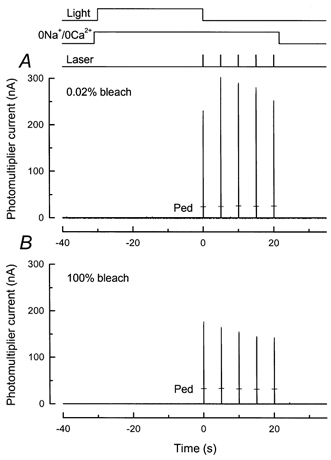
Protocol for experiment is illustrated by the light and solution monitors at top of the figure. The rod outer segment was stepped into 0 Ca2+, 0 Na+ solution and 1 s later was illuminated for 30 s with a light of variable intensity. Then, 100 ms after this light was extinguished, the first of 5 laser flashes was delivered, each 100 ms in duration and separated by 5 s intervals. The outer segment remained in 0 Ca2+, 0 Na+ solution for all of the laser flashes. Responses to a second exposure to 0 Ca2+, 0 Na+ solution and series of laser flashes after return to Ringer solution are indicated by the bars (Ped). Laser intensity, 2.6 × 10¹⁰ photons μm−2 s−1. A, intensity of pre-exposure, 1.29 × 10³ photons μm−2 s−1. Total bleach after 30 s was 0.02 %. B, intensity of pre-exposure, 1.68 × 10⁸ photons μm−2 s−1, given in equivalent photons at 500 nm for white light, calibrated as described in the Methods. The total bleach calculated after 30 s approached 100 %. Note the suppression of fluorescence increase.