
Figure 2. 5-HT modulates the amplitude of the presynaptic Ca2+ transient.
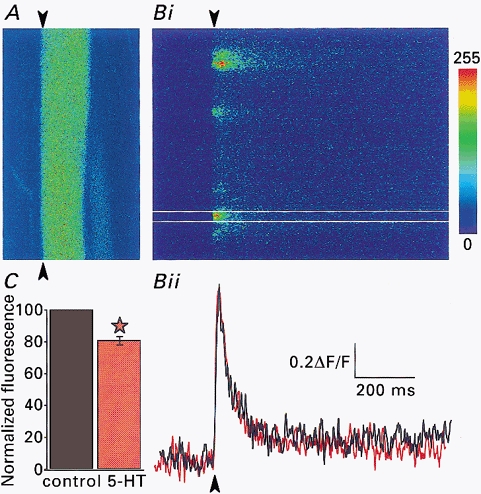
A, axon labelled with the Ca2+-sensitive dye Oregon Green 488 BAPTA-1. Bi, line scan of the axon shown in A along the line indicated by the arrowheads at 500 Hz in the presence of 50 μm AP5 and 10 μm CNQX. The laser scanned repetitively over the same line and the resultant fluorescence trace is displayed with time along the x-axis and distance along the axon on the y-axis. A single stimulus was given (arrowhead) leading to a transient increase in fluorescence level (i.e. [Ca2+]i). Bii, integrated plot of line scan from the part of Bi between the two white lines, in control (black) and in the presence of 30 μm 5-HT (red) At each time point, the fluorescence level was averaged, then normalized to the prestimulus level. C, pooled data of similar experiments to that in B (30 axons). The asterisk indicates a significant difference from control P < 0.001. ‘Box’ size in A is 150 μm × 75 μm.