
Figure 3. Relationship between the magnitude of presynaptic Ca2+ entry and the release of neurotransmitter.
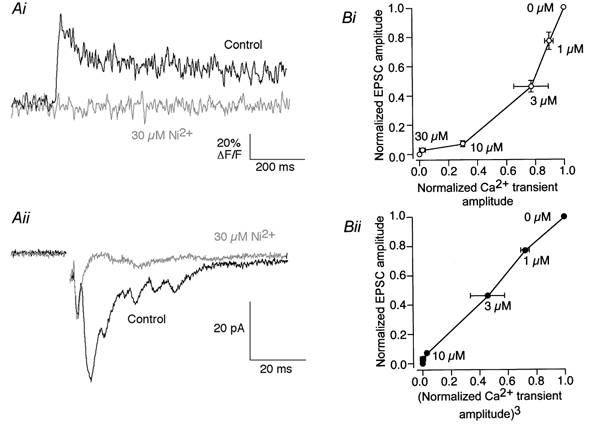
Ai, a Ca2+ transient in the reticulospinal axon (measured as in Fig. 2) was blocked by 30 μm Ni2+. Aii, an EPSC was recorded from a ventral horn neuron by extracellularly stimulating the reticulospinal axons in the ventro-medial tracts. The compound EPSC was also blocked by 30 μm Ni2+. Bi, relationship between evoked EPSC amplitude and presynaptic Ca2+ transient amplitude. Normalized EPSCs (n= 3) are plotted against normalized Ca2+ transients (n= 3) at the same Ni2+ concentration. Bii, the relationship shown in Bi became linear when the EPSC amplitude was plotted against the cube of the Ca2+ transient amplitude at the same [Ni2+]o.